Earthquakes & Tsunamis — Summary
Findings derived from the uploaded dataset covering 2001–2022.
Key Indicators
- Total Earthquakes (all years): 782
- Total Tsunami-Linked Events: 304
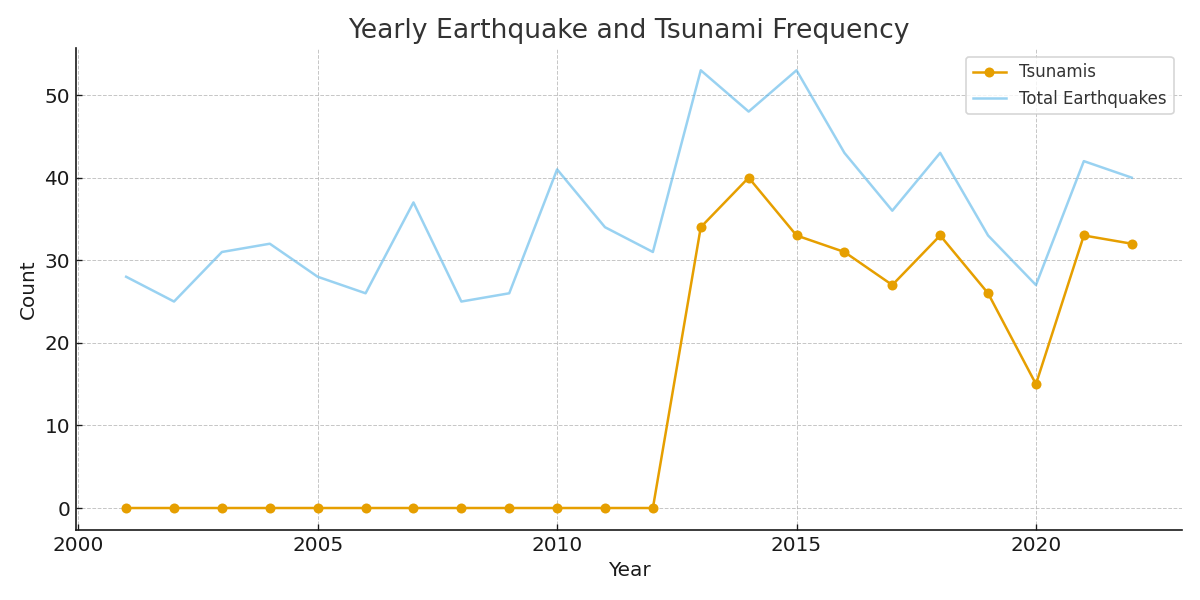
- Peak Tsunami Year: 2014 (40 events)
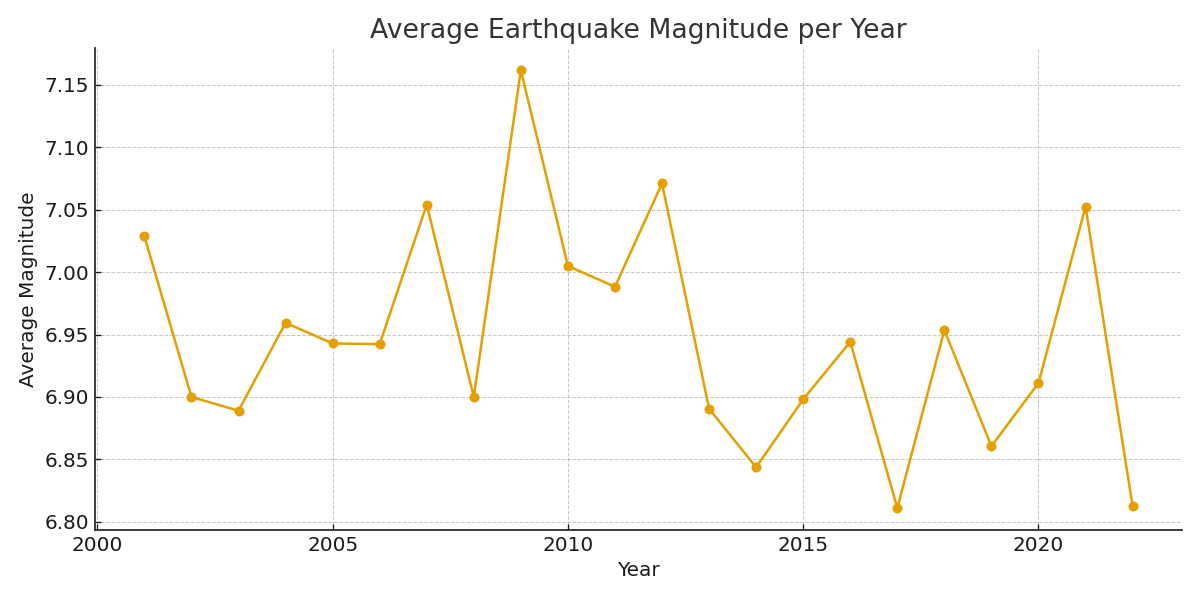
- Overall Avg Magnitude: 6.94
- Maximum Recorded Magnitude: 9.1 (Year 2011)
Pre–2013 tsunami count: 0 · From 2013 onwards: 304 — indicating a step-change in recorded tsunami linkage.
Top Years by Tsunami Events
- 2014 — 40 tsunami-linked quakes
- 2013 — 34 tsunami-linked quakes
- 2021 — 33 tsunami-linked quakes
- 2018 — 33 tsunami-linked quakes
- 2015 — 33 tsunami-linked quakes
Yearly Trends
Yearly Summary Table
| Year | total_quakes | avg_magnitude | max_magnitude | tsunami_events |
|---|---|---|---|---|
| 2001 | 28 | 7.03 | 8.40 | 0 |
| 2002 | 25 | 6.90 | 7.90 | 0 |
| 2003 | 31 | 6.89 | 8.16 | 0 |
| 2004 | 32 | 6.96 | 9.10 | 0 |
| 2005 | 28 | 6.94 | 8.60 | 0 |
| 2006 | 26 | 6.94 | 8.30 | 0 |
| 2007 | 37 | 7.05 | 8.40 | 0 |
| 2008 | 25 | 6.90 | 7.90 | 0 |
| 2009 | 26 | 7.16 | 8.10 | 0 |
| 2010 | 41 | 7.00 | 8.80 | 0 |
| 2011 | 34 | 6.99 | 9.10 | 0 |
| 2012 | 31 | 7.07 | 8.60 | 0 |
| 2013 | 53 | 6.89 | 8.30 | 34 |
| 2014 | 48 | 6.84 | 8.20 | 40 |
| 2015 | 53 | 6.90 | 8.30 | 33 |
| 2016 | 43 | 6.94 | 7.90 | 31 |
| 2017 | 36 | 6.81 | 8.20 | 27 |
| 2018 | 43 | 6.95 | 8.20 | 33 |
| 2019 | 33 | 6.86 | 8.00 | 26 |
| 2020 | 27 | 6.91 | 7.80 | 15 |
| 2021 | 42 | 7.05 | 8.20 | 33 |
| 2022 | 40 | 6.81 | 7.60 | 32 |
Averages are rounded to two decimals.